1
Please refer to important disclosures at the end of this report
1
1
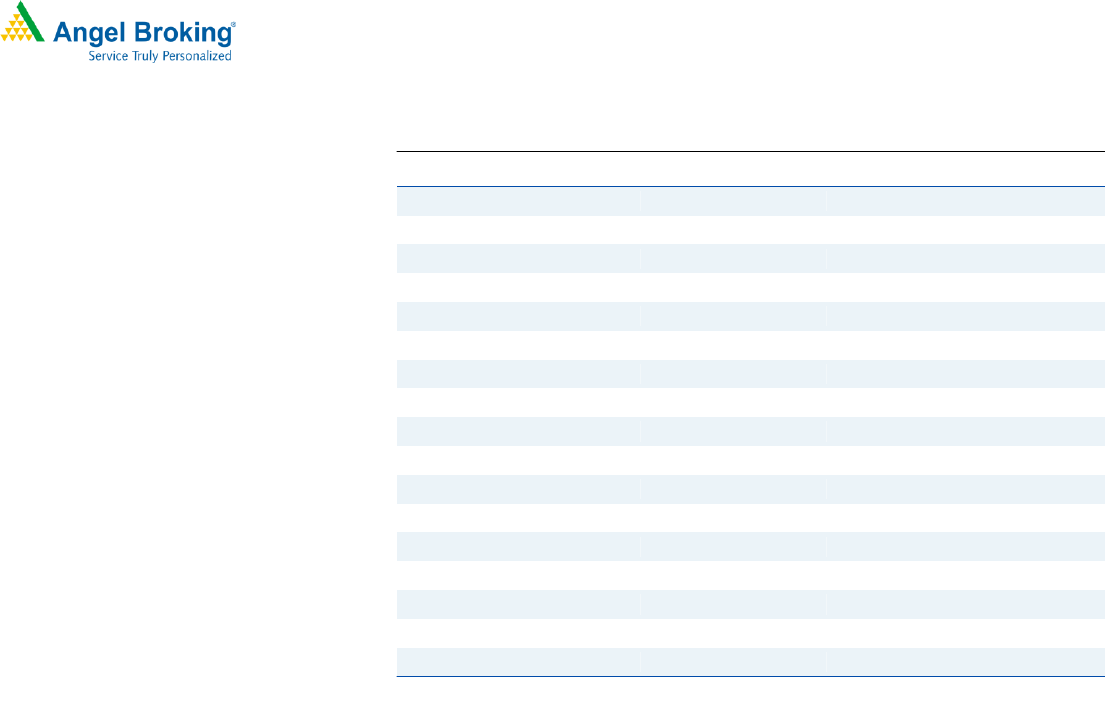
Standalone (` cr)
Q3FY19
Q3FY18
% yoy
Q2FY20
% qoq
Net sales
136.6
105.6
29.4%
136.1
0.4%
EBITDA
28.6
16.7
71.7%
26.7
7.1%
EBITDA margin (%)
21.0%
15.8%
19.6%
Adjusted PAT
19.4
10.9
78.3%
18.0
7.8%
Source: Company, Angel Research
For Q3FY2020, GMM Pfaudler (GMM) posted a yoy growth of 29.4%/78.3% in
revenue/ led by margin expansion. The company is seeing good traction from its
user industries like chemicals and agro chemicals agrochemicals which are seeing
robust capex owing to shift in production from China.
Broad based growth: Q3’s top-line growth was driven across all verticals. GL
equipment segment registered a growth of 18.8% YoY while non GL segment
grew by 52.1% YoY. Heavy engineering segment grew by 51.8% YoY while
Proprietary products division too grew by 52.2% YoY.
Strong operating performance: Operating margin were robust at 21.0% due to
better realizations and lower raw material costs. Management has indicated that
margins are expected to remain stable at current levels on account of benign raw
material costs and commissioning of new gas based furnace in Q4FY20.
Outlook and Valuation: We expect GMM Pfaudler to post CAGR of ~23%/39% in
revenue/ earnings over FY19-22E. Management has indicated that the company
is going to add two more gas based furnace from Q2FY21 which will help drive
the GL business. Management also sounded positive on the heavy engineering
business which is expected to scale up significantly in FY21. Hence, we
recommend Accumulate with a target price of `3437 (30x FY2022E EPS).
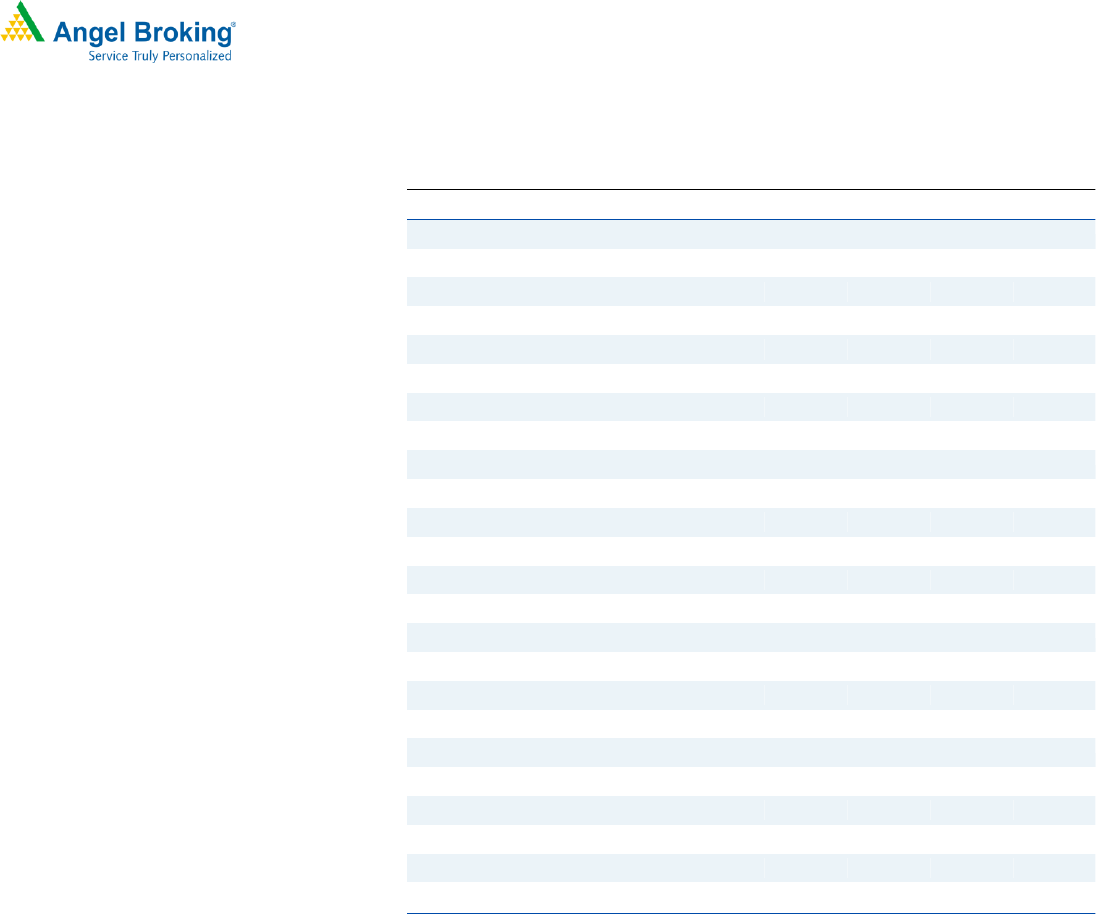
Key Financials
Y/E March (` cr)
FY2018
FY2019
FY2020E
FY2021E
FY2022E
Net Sales
405.7
525.7
681.4
834.5
981.6
% chg
14.9
29.6
29.6
22.5
17.6
Net Profit
42.7
61.4
112.9
140.1
166.8
% chg
28.3
44.0
83.7
24.1
19.1
EBITDA (%)
15.3
17.1
22.2
22.3
22.4
EPS (Rs)*
29.2
42.1
77.3
95.9
114.5
P/E (x)
110.9
77.0
41.9
33.8
28.4
P/BV (x)
20.5
16.7
12.5
9.5
7.4
RoE (%)
18.5
21.7
29.9
28.2
26.2
RoCE (%)
22.7
28.1
36.9
35.0
32.4
EV/EBITDA
74.7
51.3
30.1
24.0
19.8
EV/Sales
11.4
8.8
6.7
5.4
4.4
Source: Company, Angel Research, closing price at the end of 12
th
February 2020
GMM Pfaudler Limited
Performance Update
Accumulate
CMP `3241.2
Target Price `3437.0
Investment Period 12 Months
Stock Info
Sector
Bloomberg Code
Shareholding Pattern (%)
Promoters 75.0
MF / Banks / Indian Fls 1.9
FII / NRIs / OCBs 1.2
Indian Public / Others 21.9
Beta
0.7
Industrial Machinery
Market Cap (` cr)
4,738
52 Week High / Low
3347/1021
Avg. Daily Volume
68,375
Face Value (`)
2
BSE Sensex
41,568
Nifty
12,201
Reuters Code
GMMP.BO
GMM.IN
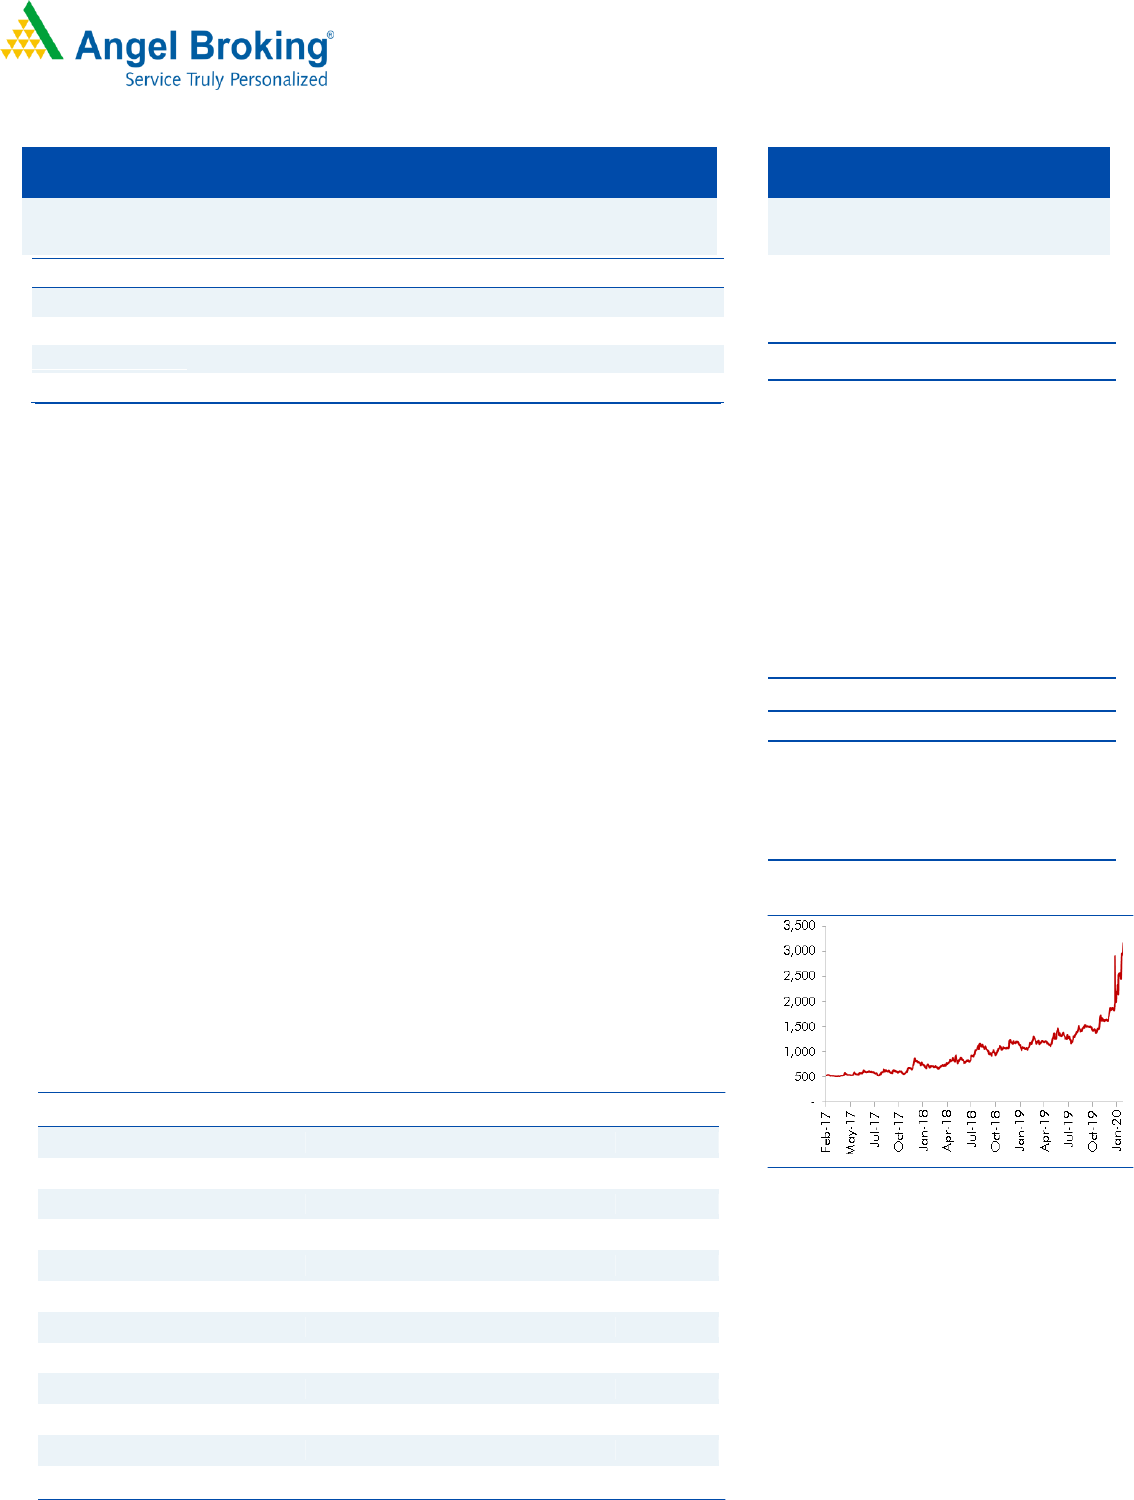
Price Chart
Source: Company, Angel Research
Jyoti Roy
022-39357800 Ext: 6842
jyoti.roy@angelbroking.com
Q3FY2020 Result Update | Industrial Machinery
February 12, 2020
2
GMM Pfaudler |3QFY2020 Result Update
February 12, 2020
2
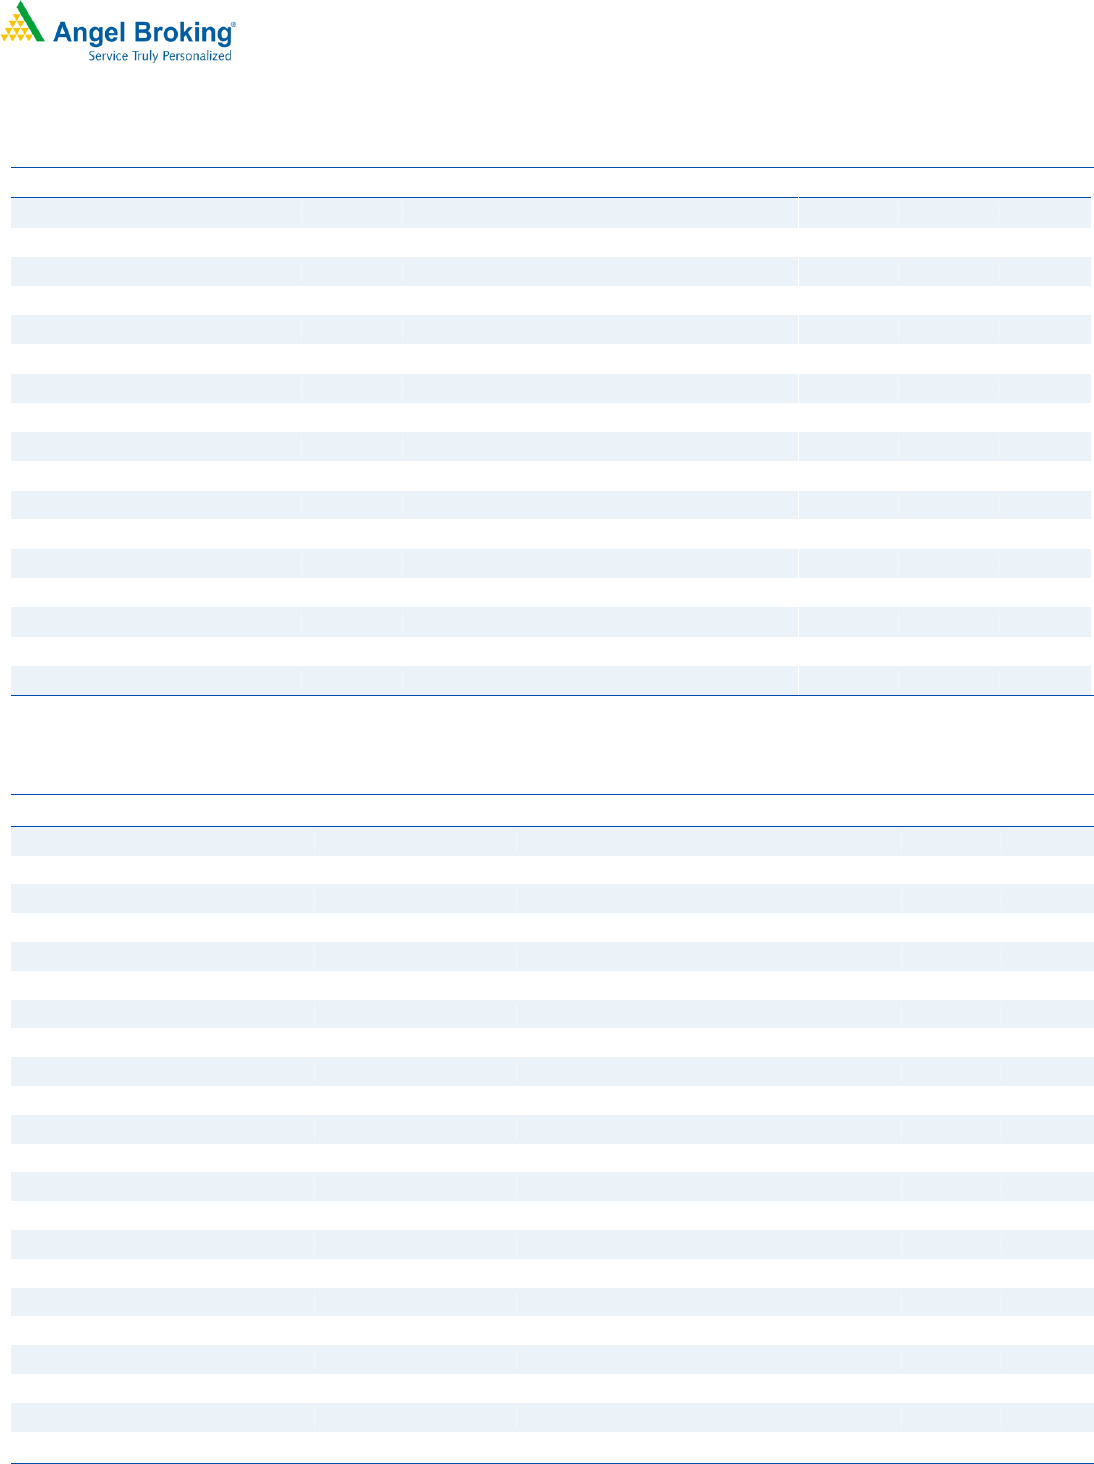
Q3 results at a glance
Standalone results – ` cr
Q3FY19
Q2FY20
Q3FY20
YoY %
QoQ %
M9FY20
M9FY19
YoY %
Net Sales
105.6
136.1
136.6
29.4%
0.4%
403.0
298.0
35.2%
Raw Material Consumed
59.8
53.8
64.9
8.5%
20.7%
187.8
157.3
19.4%
Stock Adjustment
-8.6
7.7
-3.1
-64.3%
-139.9%
-4.9
-7.8
-37.8%
Employee Expenses
10.1
14.2
13.8
36.1%
-2.8%
41.0
30.5
34.5%
Other Expenses
27.7
33.8
32.4
17.0%
-4.1%
99.7
70.1
42.2%
Total Expenditure
88.9
109.4
108.0
21.4%
-1.3%
323.7
250.1
29.4%
EBITDA
16.7
26.7
28.6
71.5%
7.3%
79.3
47.9
65.5%
Other Income
2.1
0.7
2.9
38.4%
301.9%
4.8
5.3
-9.0%
Interest
0.3
1.1
0.9
212.3%
-11.3%
2.6
0.8
223.9%
Depreciation
2.8
4.9
5.5
94.7%
11.9%
14.4
7.9
82.2%
PBT
15.7
21.5
25.2
60.3%
17.1%
67.1
44.4
51.2%
Tax
5.3
3.5
5.7
8.4%
65.8%
15.0
15.3
-1.9%
Reported PAT
10.9
18.0
19.4
78.1%
7.7%
52.1
29.7
75.4%
Ratios
EBITDA margin %
15.8%
19.6%
21.0%
19.7%
16.1%
PAT margin %
10.3%
13.2%
14.2%
12.9%
10.0%
Tax rate %
30.5%
16.1%
22.8%
22.4%
34.4%
Source: Company, Angel Research
Segmental performance
` cr
Q3FY19
Q2FY20
Q3FY20
YoY %
QoQ %
M9FY20
M9FY19
YoY %
Revenue from Operations
106.6
136.1
136.6
28.2%
0.4%
403.0
299.0
34.8%
Glass Lined Equipments
76.7
84.0
91.1
18.8%
8.5%
271.4
209.7
29.4%
Heavy Engineering
9.9
20.2
15.0
51.8%
-25.7%
41.5
33.9
22.5%
Proprietary Products
20.0
31.9
30.4
52.2%
-4.5%
90.0
55.3
62.7%
Non GL segment
29.9
52.1
45.5
52.1%
-12.7%
131.5
89.2
47.5%
As a % of revenue
Glass Lined Equipments
72.0%
61.7%
66.7%
67.4%
70.0%
Heavy Engineering
9.0%
14.9%
11.0%
10.3%
11.0%
Proprietary Products
19.0%
23.4%
22.3%
22.3%
18.0%
Non GL segment
28.0%
38.3%
33.3%
32.6%
30.0%
PBIT
17.6
27.0
28.7
63.2%
6.5%
78.6
50.7
55.0%
Glass Lined Equipments
13.9
18.9
20.1
44.7%
6.7%
57.7
39.1
47.6%
Heavy Engineering
1.4
2.4
4.2
198.6%
71.6%
6.8
6
13.2%
Proprietary Products
2.3
5.7
4.4
92.6%
-22.1%
14.1
5.6
151.8%
Non-GL segment
3.6
8.1
8.6
139.1%
6.0%
20.9
11.6
80.1%
PBIT margin %
16.5%
19.8%
21.0%
19.5%
17.0%
Glass-Lined segment
18.2%
22.5%
22.1%
21.3%
18.6%
Heavy Engineering
13.7%
12.0%
27.8%
16.3%
17.6%
Proprietary Products
11.3%
17.8%
14.5%
15.7%
10.2%
Non-GL segment
12.1%
15.6%
18.9%
15.9%
13.0%
Source: Company, Angel Research

3
GMM Pfaudler |3QFY2020 Result Update
February 12, 2020
3
Risks to our estimates
GMM’s primary raw material is steel; any abrupt fluctuation in pricing will
adversely impact its profitability.
Business may get impacted owing to the inability to get break through with
new clients or slowdown in capex by its clients.
GMM has market exposure to foreign exchange rates mainly on account
of exports, imports and investments in foreign subsidiary, and therefore, it
is subjected to the exchange fluctuation risk.
4
GMM Pfaudler |3QFY2020 Result Update
February 12, 2020
4
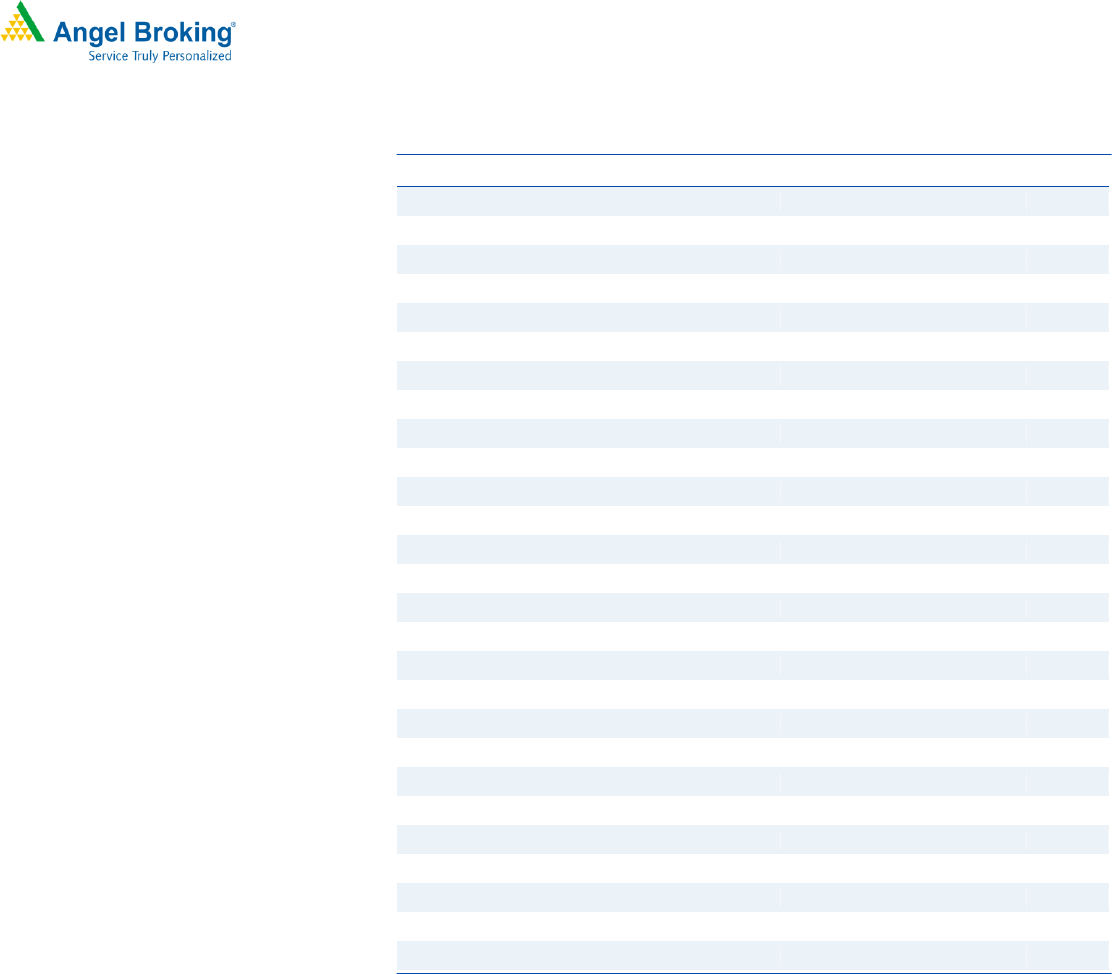
Profit & Loss Statement
Y/E March (` cr)
FY2018
FY2019
FY2020E
FY2021E
FY2022E
Total operating income
405.7
525.7
681.4
834.5
981.6
% chg
14.9
29.6
29.6
22.5
17.6
Total Expenditure
336.7
435.6
530.1
648.4
761.7
COGS
240.9
312.1
367.9
450.6
530.1
Selling and Administration Expenses
23.7
30.7
40.9
50.1
58.9
Personnel
63.5
82.3
107.0
129.3
151.2
Others Expenses
8.7
10.5
14.3
18.4
21.6
EBITDA
69.0
90.1
151.3
186.1
219.9
% chg
44.5
30.6
67.9
23.0
18.2
(% of Net Sales)
17.0
17.1
22.2
22.3
22.4
Depreciation& Amortisation
9.8
10.8
11.7
12.7
13.7
EBIT
59.2
79.3
139.6
173.4
206.2
% chg
49.8
34.0
76.0
24.2
18.9
(% of Net Sales)
14.6
15.1
20.5
20.8
21.0
Interest & other Charges
1.0
1.0
1.0
1.0
1.0
Other Income
9.4
10.8
12.4
14.9
17.9
(% of Sales)
2.3
2.1
1.8
1.8
1.8
Extraordinary Items
-
-
-
-
-
Share in profit of Associates
-
-
-
-
-
Recurring PBT
67.5
89.1
150.9
187.3
223.0
% chg
44.1
31.9
69.5
24.1
19.1
Tax
18.0
27.6
38.0
47.2
56.2
PAT (reported)
42.7
61.4
112.9
140.1
166.8
% chg
28.3
44.0
83.7
24.1
19.1
(% of Net Sales)
10.5
11.7
16.6
16.8
17.0
Basic & Fully Diluted EPS (Rs)
29.2
42.1
77.3
95.9
114.5
% chg
28.3
44.0
83.7
24.1
19.1
Source: Company, Angel Research
5
GMM Pfaudler |3QFY2020 Result Update
February 12, 2020
5
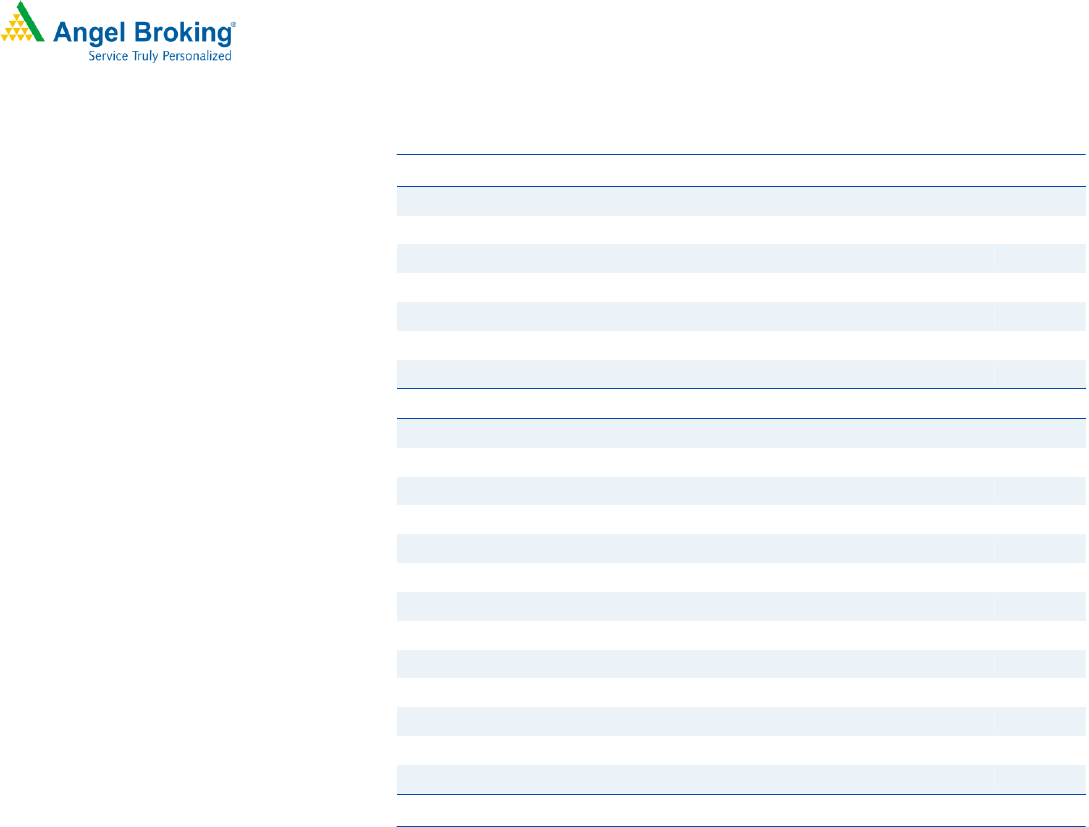
Consolidated Balance Sheet
Y/E March (` cr)
FY2018
FY2019
FY2020E
FY2020E
FY2020E
SOURCES OF FUNDS
Equity Share Capital
2.9
2.9
2.9
2.9
2.9
Reserves& Surplus
227.9
279.7
375.0
493.1
633.9
Shareholders Funds
230.8
282.7
377.9
496.1
636.8
Minority Interest
-
-
-
-
-
Total Loans
-
-
-
-
-
Other Liab & Prov
11.6
12.1
12.8
13.6
14.6
Total Liabilities
242.4
294.8
390.7
509.7
651.4
APPLICATION OF FUNDS
Net Block
66.4
70.6
73.9
76.2
77.5
Capital Work-in-Progress
2.0
2.0
2.0
2.0
2.0
Investments
64.6
84.6
94.6
104.6
114.6
Current Assets
233.2
290.7
418.7
570.0
743.2
Inventories
94.5
122.5
158.8
194.4
228.7
Sundry Debtors
80.3
104.1
134.9
165.2
194.4
Cash
30.6
28.2
78.5
153.3
253.1
Loans & Advances
27.7
35.9
46.5
57.0
67.0
Other Assets
-
-
-
-
-
Current liabilities
127.9
158.4
205.3
251.5
295.8
Net Current Assets
105.3
132.3
213.3
318.5
447.4
Other Non Current Asset
4.1
5.3
6.8
8.3
9.8
Total Assets
242.4
294.8
390.7
509.7
651.4
Source: Company, Angel Research
6
GMM Pfaudler |3QFY2020 Result Update
February 12, 2020
6
Consolidated Cash flow Statement
Y/E March (` cr)
FY2018
FY2019
FY2020E
FY2020E
FY2020E
Profit before tax
60.7
89.1
150.9
187.3
223.0
Depreciation
9.8
10.8
11.7
12.7
13.7
Change in Working Capital
(9.7)
(29.3)
(30.8)
(30.3)
(29.1)
Interest / Dividend (Net)
-
-
-
-
-
Direct taxes paid
(18.0)
(27.6)
(38.0)
(47.2)
(56.2)
Others
-
-
-
-
-
Cash Flow from Operations
42.8
42.9
93.8
122.5
151.4
(Inc.)/ Dec. in Fixed Assets
(15.0)
(15.0)
(15.0)
(15.0)
(15.0)
(Inc.)/ Dec. in Investments
-
-
-
-
-
Cash Flow from Investing
(36.9)
(35.4)
(25.5)
(25.5)
(25.5)
Issue of Equity
-
-
-
-
-
Inc./(Dec.) in loans
-
-
-
-
-
Others
6.7
9.6
17.7
21.9
26.1
Cash Flow from Financing
(6.7)
(9.6)
(17.7)
(21.9)
(26.1)
Inc./(Dec.) in Cash
(0.8)
(2.1)
50.6
75.1
99.8
Opening Cash balances
31.1
30.3
28.2
78.8
153.9
Closing Cash balances
30.3
28.2
78.8
153.9
253.7
Source: Company, Angel Research
7
GMM Pfaudler |3QFY2020 Result Update
February 12, 2020
7
Key Ratios
Y/E March
FY18
FY19
FY20E
FY21E
FY22E
Valuation Ratio (x)
P/E (on FDEPS)
110.9
77.0
41.9
33.8
28.4
P/CEPS
65.6
47.1
26.8
21.8
18.4
P/BV
20.5
16.7
12.5
9.5
7.4
Dividend yield (%)
0.1
0.2
0.3
0.4
0.5
EV/Sales
11.4
8.8
6.7
5.4
4.4
EV/EBITDA
74.7
51.3
30.1
24.0
19.8
EV / Total Assets
19.1
15.7
11.7
8.8
6.7
Per Share Data (`)
EPS (Basic)
29.2
42.1
77.3
95.9
114.5
EPS (fully diluted)
29.2
42.1
77.3
95.9
114.5
Cash EPS
49.4
68.8
120.9
148.8
176.2
DPS
4.0
5.5
10.1
12.5
14.9
Book Value
158.1
193.6
258.8
339.8
436.2
Returns (%)
ROCE
22.7
28.1
36.9
35.0
32.4
Angel ROIC (Pre-tax)
35.5
43.6
64.1
68.9
72.7
ROE
18.5
21.7
29.9
28.2
26.2
Turnover ratios (x)
Asset Turnover (Gross Block)
3.2
3.8
4.4
4.9
5.3
Inventory / Sales (days)
85
85
85
85
85
Receivables (days)
72
72
72
72
72
Payables (days)
115
110
110
110
110
WC cycle (ex-cash) (days)
42
47
47
47
47
Source: Company, Angel Research, closing price at the end of 12
th
February 2020

8
GMM Pfaudler |3QFY2020 Result Update
February 12, 2020
8
Research Team Tel: 022 - 39357800 E-mail: research@angelbroking.com Website: www.angelbroking.com
DISCLAIMER
Angel Broking Limited (hereinafter referred to as “Angel”) is a registered Member of National Stock Exchange of India Limited,
Bombay Stock Exchange Limited and Metropolitan Stock Exchange Limited. It is also registered as a Depository Participant with CDSL
and Portfolio Manager and Investment Adviser with SEBI. It also has registration with AMFI as a Mutual Fund Distributor. Angel
Broking Limited is a registered entity with SEBI for Research Analyst in terms of SEBI (Research Analyst) Regulations, 2014 vide
registration number INH000000164. Angel or its associates has not been debarred/ suspended by SEBI or any other regulatory
authority for accessing /dealing in securities Market. Angel or its associates/analyst has not received any compensation / managed or
co-managed public offering of securities of the company covered by Analyst during the past twelve months.
This document is solely for the personal information of the recipient, and must not be singularly used as the basis of any investment
decision. Nothing in this document should be construed as investment or financial advice. Each recipient of this document should
make such investigations as they deem necessary to arrive at an independent evaluation of an investment in the securities of the
companies referred to in this document (including the merits and risks involved), and should consult their own advisors to determine
the merits and risks of such an investment.
Reports based on technical and derivative analysis center on studying charts of a stock's price movement, outstanding positions and
trading volume, as opposed to focusing on a company's fundamentals and, as such, may not match with a report on a company's
fundamentals. Investors are advised to refer the Fundamental and Technical Research Reports available on our website to evaluate the
contrary view, if any
The information in this document has been printed on the basis of publicly available information, internal data and other reliable
sources believed to be true, but we do not represent that it is accurate or complete and it should not be relied on as such, as this
document is for general guidance only. Angel Broking Limited or any of its affiliates/ group companies shall not be in any way
responsible for any loss or damage that may arise to any person from any inadvertent error in the information contained in this report.
Angel Broking Limited has not independently verified all the information contained within this document. Accordingly, we cannot
testify, nor make any representation or warranty, express or implied, to the accuracy, contents or data contained within this document.
While Angel Broking Limited endeavors to update on a reasonable basis the information discussed in this material, there may be
regulatory, compliance, or other reasons that prevent us from doing so.
This document is being supplied to you solely for your information, and its contents, information or data may not be reproduced,
redistributed or passed on, directly or indirectly.
Neither Angel Broking Limited, nor its directors, employees or affiliates shall be liable for any loss or damage that may arise from or in
connection with the use of this information.
Disclosure of Interest Statement GMM Pfaudler
1. Financial interest of research analyst or Angel or his Associate or his relative No
2. Ownership of 1% or more of the stock by research analyst or Angel or associates or relatives No
3. Served as an officer, director or employee of the company covered under Research No
4. Broking relationship with company covered under Research No
Ratings (Based on Expected Returns: Buy (> 15%) Accumulate (5% to 15%) Neutral (-5 to 5%)
Over 12 months investment period) Reduce (-5% to -15%) Sell (< -15%)
Hold (Fresh purchase not recommended)